
In the nearly 18 months since the start of the COVID-19 pandemic, we’ve seen just about every aspect of our lives change, including some areas we long considered constants. In the financial world, long-standing economic indicators lost some of their predictive and explanatory powers. Due to the volatility and unpredictable nature of the pandemic, data from construction data, retail sales information and the monthly jobs report published by the Bureau of Labor Statistics (BLS) indicators become outdated far sooner than under normal circumstances.
Analysts had to reexamine where the most reliable information could be found. Monthly data sources were completely missing rapid changes happening at the level of the typical worker and consumer. These conventional economic indicators are still important for long-term data analysis, but on the day-to-day level, economists have shifted their focuses and tuned in to high-frequency economic indicators.
What are high-frequency economic indicators?
As the name implies, high-frequency economic indicators are available more frequently than conventional indicators and capture data at the consumer level.
Examples include federally sourced information published on a weekly or daily cadence, such as weekly job reports and unemployment claims and daily gate traffic data from the Transportation Security Administration (TSA). Every morning, the TSA publishes the previous day’s traveler throughput numbers alongside numbers for the same day of the week in 2019 and 2020, helping analysts to quickly and efficiently compare data.
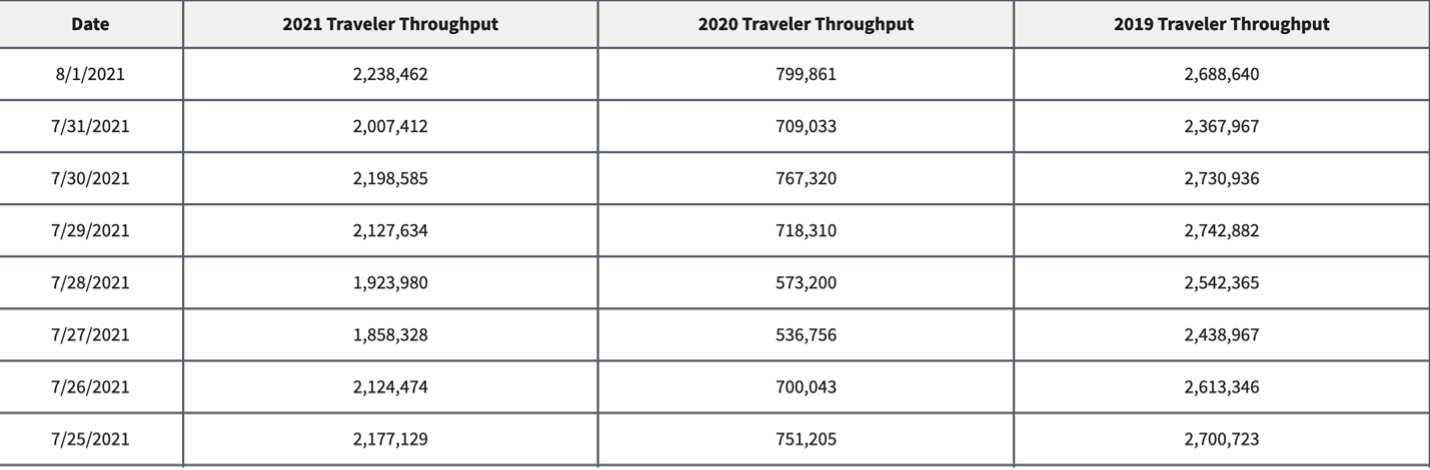
TSA checkpoint travel numbers (current year versus prior year(s)/same weekday)
Source: Transportation Security Administration
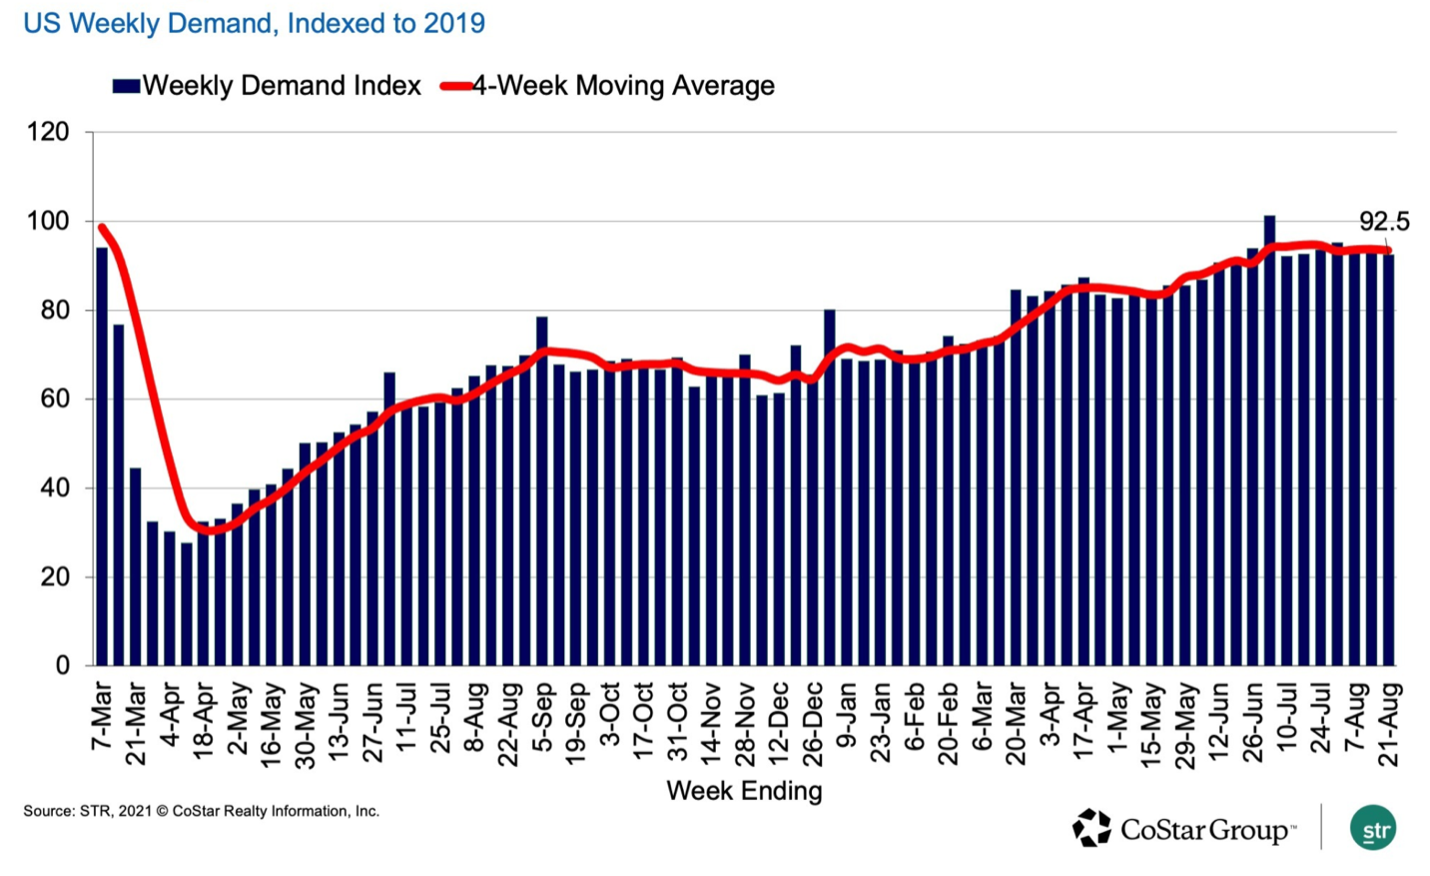
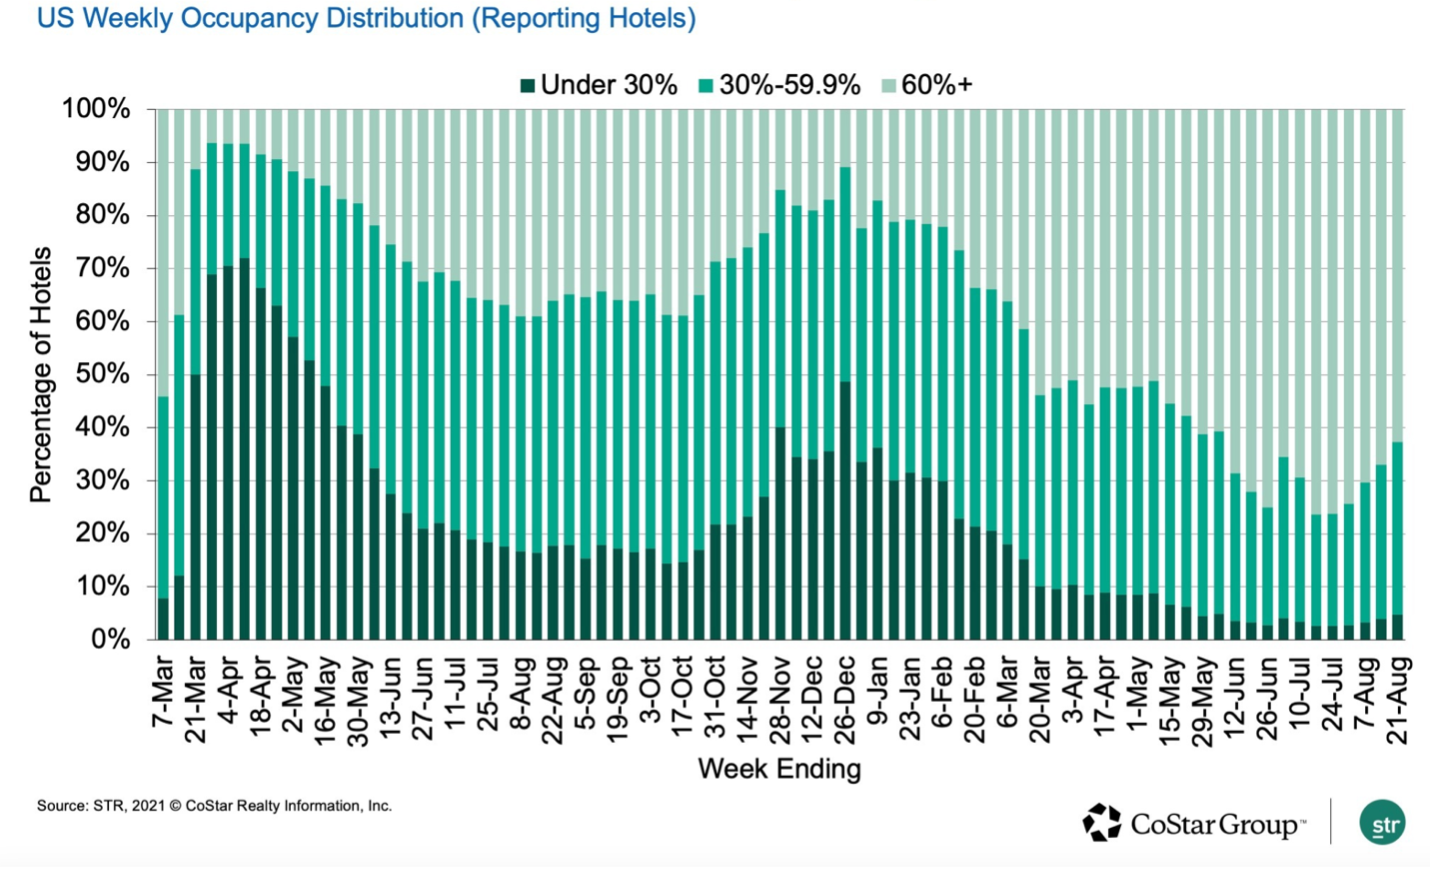
What most sets high-frequency economic indicators apart from conventional indicators, however, is that they dip far deeper into the consumer level. We’re talking geolocation data, credit card transactions, hotel bookings, restaurant reservations and even direction requests from navigation apps. This information is sourced from private companies that are well-known and/or regularly patronized by the average consumer. OpenTable (the popular restaurant reservations app owned by Booking Holdings, Inc.), CoStar (a commercial real estate data firm that publishes weekly hotel occupancy data) and Apple Maps (which publishes a daily Mobility Trends Report on all types of transportation), for instance, all make their information available.
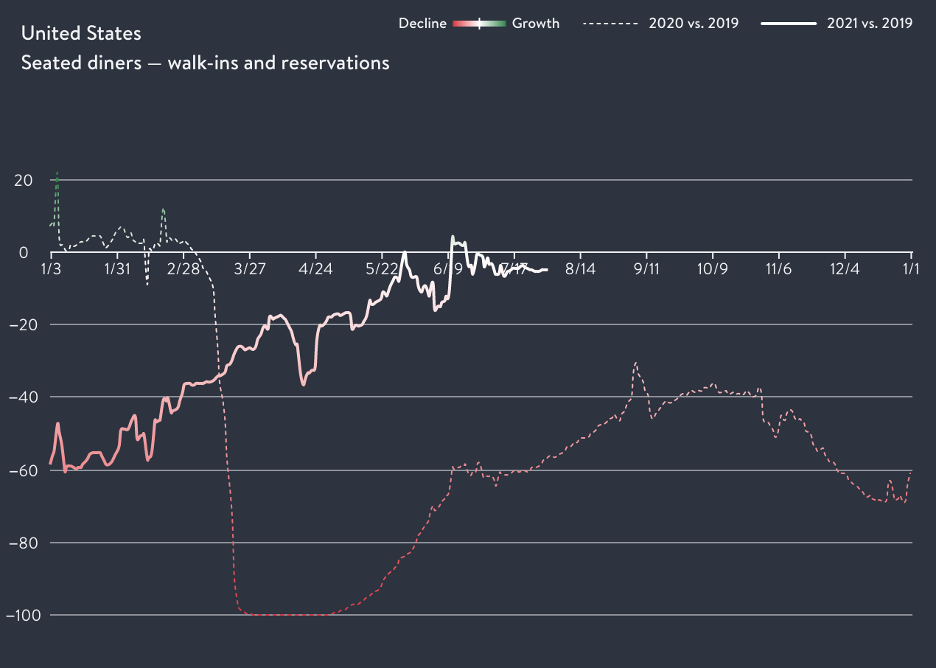
Seated Diners from Online, Phone and Walk-in Reservations in the United States
Source: OpenTable, State of the Industry
Economists rely on this piecemeal, minute-level data on consumer activity to paint an accurate picture of the current economic climate, however volatile and ever-evolving it may be from one day to the next.
Putting the data to use
American Public Media’s Marketplace program recently aired a segment describing how high-frequency indicators provide economists with real-time insight into consumer and worker activity. The segment explained how the Federal Reserve Bank of Dallas incorporates high-frequency inputs from OpenTable’s restaurant reservations, credit and debit card transactions processed by Affinity Solutions, cellphone geolocation data from SafeGraph, Inc. and hours-worked data from Homebase (a provider of employee scheduling and time-tracking software) to construct a model of likely employment numbers each week. This model helps the Dallas Fed forecast Texas employment and more accurately assess the potential economic impact of abnormal events. While conventional indicators suggested the extreme winter storms in February 2021 had caused $130 billion worth of damage and losses, the Dallas Fed’s high-frequency data showed how the storms affected employment for only a week.[1]
The Dallas Fed’s experience was just one example of how high-frequency indicators can reveal data conventional indicators miss. Recognition of these information gaps increased after economists were surprised by BLS’s May 2020 jobs report. Economists relying on conventional indicators expected payrolls to drop by 8.33 million and the unemployment rate to rise to 19.5%.[2] Instead, the jobless rate declined to 13.3% and payrolls rose by 2.5 million.[3] About half of the jobs gained were in the hospitality and leisure sector, with many workers being rehired after layoffs during the pandemic lockdown. While economic recovery was, of course, preferable to disaster, the reported numbers were a wake-up call that economists were working with stale or incomplete information – the economy moved faster than the data.
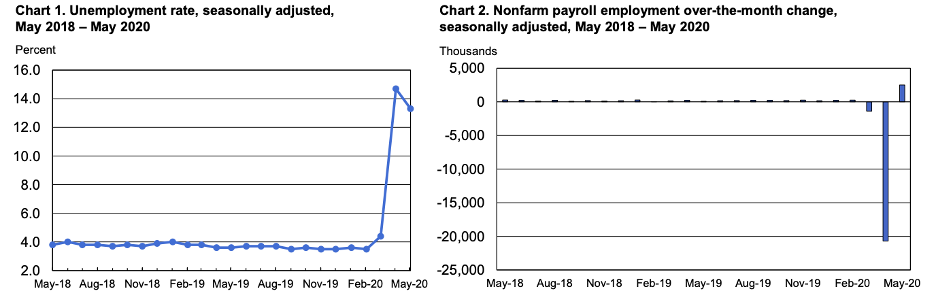
Source: Bureau of Labor Statistics
Where do we stand?
High frequency data points were useful to us during the onset and immediate aftermath of the pandemic-related shutdowns. We regularly looked at the inner workings of weekly jobless claims data, consumer credit card usage, hotel and office occupancy rates, Covid-19 related hospitalizations by state, gasoline consumption and more. As fiscal stimulus dollars found their way to consumers and businesses, the data helped support our views on potential economic recovery.
With consumer spending representing almost 70% of the overall US economy,[4] we recognize the value of real-time or near-real-time data for evaluating broader economic activity. Consumer spending patterns fluctuated wildly during the pandemic, and routines were thrown off track. Americans reallocated “dining out” dollars for stocking up on toilet paper and hand sanitizer, travel budgets went untouched, and the need to use navigation systems took a sharp decline as travelers hunkered down at home. All the while, economists were using this quantitative and qualitative data — as well as accounting for the likely impact of vaccination rates on city and state reopening plans — to forecast the economy’s strengths, weaknesses and needs.
We still track several high frequency economic indicators as part of our broader macro-economic analysis but note that many of the data points we look at today have evolved as the economy recovered. Short-term indicators were very useful when we were concerned with widespread business failure and implications for another financial crisis, but now our attention is on the durability of the economic expansion. For example, in looking at recent hotel occupancy rates, we question whether the increase is driven more by vacation travel or business travel. Over the next several months, this data may give us better insight on business travel and the implications for the hospitality industry, airline travel, etc.
The pandemic certainly widened the gap between standard indicators and on-the-ground economic activity, but it’s clear that the gap has always existed. We expect high-frequency indicators will retain their increased relevance even in a post-COVID world, with some joining lower-frequency indicators in the typical economist’s toolkit.
_______________________
[1] CNBC, “May sees biggest jobs increase ever of 2.5 million as economy starts to recover from coronavirus,” retrieved from https://www.cnbc.com/2020/06/05/jobs-report-may-2020.html, July 20, 2021
[2] CNBC, “May sees biggest jobs increase ever of 2.5 million as economy starts to recover from coronavirus,” retrieved from https://www.cnbc.com/2020/06/05/jobs-report-may-2020.html, July 20, 2021
[3] Ibid
[4] U.S. Bureau of Economic Analysis, Shares of gross domestic product: Personal consumption expenditures [DPCERE1Q156NBEA], retrieved from FRED, Federal Reserve Bank of St. Louis; https://fred.stlouisfed.org/series/DPCERE1Q156NBEA, July 20, 2021.
Blog commentary and opinions expressed herein represent a snapshot in time and are subject to change. Any discussion or information contained in this blog does not serve as the receipt of, or substitute for, personalized investment advice from Evermay.